NCAC Annual Dinner - ON TUESDAY, FEBRUARY 5!
The NCAC Annual Dinner on February 5, 2019 will be co-hosted by the Embassy of Canada. The dinner will feature Ed Morse, Global Head of Commodities Research at Citi, as the keynote speaker. Dr. Morse will present his perspective on the important energy events affecting the world and what they mean for energy markets this year.
Please join us for what promises to be a thought-provoking evening. The dinner is February 5, from 6 PM - 9 PM at the Embassy of Canada, 501 Pennsylvania Avenue NW, Washington, D.C.
Rare Technical Tour Opportunity - Washington Gas Light’s “Pipetown” – February 21
The National Capital Area Chapter of the U.S. Association for Energy Economics is offering a tour of the Washington Gas Light training facility in Springfield, Virginia, on Thursday, February 21, 2019.
Bus transportation will be provided from a location near a Metro stop, most likely Smithsonian. The schedule for the event is tentatively an 8 a.m. pickup and 2 p.m. drop-off. Lunch details are forthcoming, but it is probabe that we will go to a local restaurant after the tour.
Cost for NCAC members is $60. A registration link will be provided shortly.
The facility at the company's operations center, known as Pipetown, was built to simulate an urban community. Pipetown was designed to provide the most realistic training environment possible for field operators, line supervisors and emergency responders. The intention of Pipetown is to do training in a live, controlled environment that will result in high performance, safety and efficiency.
WGL officials will also discuss gas dispatching and supervisory control and data acquisition (SCADA) software with NCAC members. If you want to know how natural gas moves to the burner tip from the city gate of a local distribution company, this is an excellent learning opportunity.
NCAC President Michael Ratner Learns about Energy in Eastern Europe
In December, I participated in an energy trip to Poland, which has undertaken multiple projects to eliminate its dependence on Russia for natural gas. Companies have signed deals to import U.S. LNG, and Polski LNG plans to double the capacity of its facility to 10 BCM.
PGNiG is constructing the Baltic Pipeline to bring 10 BCM of Norwegian natural gas via Denmark to Poland. The country also produces about 4 BCM of natural gas and consumes 19 BCM. When all the projects are completed, Poland is planning to export its excess capacity to its neighbors.
The U.S. Looks to Set New Production and Export Records for 2018
Frederick J. Lawrence, Vice President, Economics & International Affairs | Independent Petroleum Association of America
The American oil and natural gas renaissance continued to unfold with impressive growth in 2018. The U.S. has become more of a global energy player, thanks to the rising levels of production and exports, but this growth comes with new challenges as well as unprecedented opportunities.
The industry has been dealing with a rather disrupted market over the past five years, as we have seen both OPEC and non-OPEC members compete for global market share as global inventories became over-supplied leading up to and following 2014. The U.S. has been a star player in the non-OPEC group.
Unquestionably, the U.S. has solidified its role as a top tier global oil producer and will play an instrumental future role in supplying domestic energy to the world’s largest consumer as well as exporting to the growing global market which recently hit total consumption levels of 100 mmb/d.
A tug of war has emerged between the bulls (touting Iran sanctions, Venezuela production deterioration and limited spare capacity) and bears (noting slowing global demand, growing trade war frictions, weakening emerging market economies and a strong dollar) recently. But American tight oil production and export levels will be closely watched for any signs of slowdown in terms of growth, whether due to high first year decline rates, peaking sweet spots/maturity or other challenges in the field, and the ability to keep up over the long term with more long-cycle conventional production.
Long-cycle production sustainability will also have to contend with years of under-investment in the mega-projects that are necessary to sustain production growth. However, no matter how the tug of war breaks over the next year, exports of oil, natural gas liquids and natural gas (and all their associated products), look to rise in proportion to anticipated production growth and added export infrastructure.
The U.S. energy export engine has strengthened considerably over the past few years with added diversification of products and new geographical destinations. The U.S. has been exporting a long menu of petroleum products and pipeline natural gas for some time, but lifting the crude oil ban in December 2015 and the gradual growth of LNG have added notably to the trend. In the monthly Commerce Department reports, it is challenging to find any other American export that has experienced as much growth on percentage terms as energy (derived from oil and natural gas) over the past five years.
Between 2003 and 2007, the value of energy imports to the U.S. was about ten times greater than the value of exports. According to the Energy Information Administration (EIA) and the U.S. Census Bureau, imports were only about 1.5 times greater than exports. Following five percent (~464kb/d) growth in 2017, the U.S. is expecting annual oil production growth of 1.5 mmb/d this year. Natural gas and natural gas liquids volumes are also continuing to grow, whether in the massive Appalachian area or due to associated volumes in key oil-producing regions such as the Permian and Delaware Basins. Why are exports growing so quickly and why can’t we use all this energy domestically?
Because U.S. refineries prefer to process heavier and more sour crudes, continued domestic tight oil production growth (of oil which is predominantly light and sweet in quality) will correspondingly push continued export growth. According to the EIA, crude oil was the largest U.S. petroleum export in the first half of 2018, averaging 1.8 mmb/d. These exports increased almost 80 percent compared to the first half of 2017. Much of the crude went to destinations in Asia (China, S. Korea, India, etc.) and Europe (Italy, U.K., Netherlands, etc.).
The U.S. exported a record amount of 2.2 mmb/d in June but the exported crude oil is still less than half the level of petroleum product exports which constituted 70 percent of the total value of U.S. energy exports in 2017. Through September 2018, the U.S. averaged 1.8 mmb/d of crude oil exports and 5.4 mmb/d of petroleum product exports to our allies and trading partners around the world.
Similarly, the global drive for increased power generation helped natural gas grow at rates near three percent per annum last year, which will help sustain demand for U.S. liquefied natural gas in Europe, Asia and other regions. According to the EIA, the U.S. net natural gas exports in the first half of 2018 were more than double the 2017 average at 0.87 billion cubic feet per day. The U.S. became a net natural gas exporter in 2017 and this trend looks to continue in 2018 and beyond.
The top export challenges in the U.S. exist in the infrastructure and take-away arena as new pipelines and processing/storage capacity are needed in critical areas such as the Permian, to get the various production volumes to terminals on the Gulf Coast. Expanded port capacity with access to larger ships (such as VLCCs) is also needed to help U.S. production growth reach international destinations. New pricing benchmarks for U.S. West Texas crude in Houston have arrived on the scene for oil delivered to Houston/Gulf Coast refining and port hubs, because so much more crude product is being exported overseas.
Increased U.S. production has provided producers and our country with more energy and trade power optionality nationally, regionally and globally. Given our notable large petroleum imports from Canada (our largest trading partner for energy products) and the rising natural gas and petroleum product exports to Mexico, the NAFTA energy synergies remain important and the new USMCA Agreement will continue to showcase the strong and interdependent North American energy market. But this is not just a story for the Western Hemisphere, as companies are now more international in their perspective.
Energy interconnectedness is a theme that will continue to play a larger and more important role with global oil and natural gas demand continuing to grow. The U.S. will continue to have an expanded role to play in the global energy marketplace, thanks in large part to the shale revolution and the continued efforts of America’s independent oil and natural gas producers.
Facilitating Private Financing of Energy Resilience
Wil Goldenberg, Associate, Public Institutions, JLL, and Brian Oakley, Executive Vice President, Public Institutions, JLL
The commercial power grid is increasingly exposed to natural hazards as well as to man made threats, including weather-related outages, other natural disasters, and physical or cyber-attacks. The cost of an outage may be immeasurably large at facilities providing critical services such as health care or national security.
Energy resilience is defined as the ability of facilities to survive grid outages without material disruption to operations.* This can require investment in generation and storage assets which are continually maintained in a standby state. While many government entities recognize the importance of resilience, they also find funding it to be challenging. Private sector participation under a public-private partnership offers a potential solution for government entities seeking to achieve a more resilient state while funding such improvements over time.
Resilience Funding Challenge
Government entities seeking to invest in resiliency projects face several challenges in funding new projects, including:
Size of Load: Back-up power systems need to be sized to meet essential peak loads during a multiday outage (for example, water treatment at a military installation). This can require large capital expenditure to meet requirements, including isolation of critical loads with a microgrid.
Cost Justification: Standby assets provide some assurance against unexpected disruption of operations, and by design may not be used for several years in between outages. However, common approaches to power purchase and investment decision-making do not consider the value of energy security, which could justify spending more than the cost of conventional services. Some revenue-generating government entities (such as a port authority) could estimate the value of lost revenue or increased costs from outages.
Performance Assurance: Resilience projects need to be fully functional during disasters, and capital investment alone does not ensure performance. Government installations need to maintain resilience assets in a state of readiness and ensure that adequate fuel is available at all times.
While the threat of grid disruptions is perceived to be increasing, resilience has not emerged as a funding priority, often resulting in facilities employing a patchwork of solutions that does not fully cover all critical loads.
Private Sector Solutions
Through public-private partnerships (P3)—also referred to as third-party financing—the private sector can help government entities improve resilience through expertise, risk sharing and financing. This can be achieved through a long-term agreement whereby a private developer designs and invests in a resilience project at a government facility in exchange for a stream of payments. Two models include:
Leveraging Assets: Many systems which provide backup power during an outage can also provide valuable services when the grid is functioning properly. For example, several US military installations have allowed power companies to build power plants on their property to serve the electric grid. In return, the plants are capable of being turned inward during a grid outage to serve the needs of the base.
Service Contracts: The government entity will commit to a series of payments that provides developers with steady revenue on which financing can be raised. This approach may be particularly attractive for standby energy resilience projects which only provide service in the event of an outage and is analogous to capacity payments in conventional power plant project finance.
Depending on accounting conventions, third-party financing may be off-balance sheet for a government entity. For federal entities, such arrangements may avoid capital budgeting rules and allow assets to be financed over time with operating dollars while accessing focused technical expertise from the private sector.
Risk Allocation
Service quality presents a greater challenge for resilience projects than for conventional ones because failure during a disaster may be catastrophic. Conventional remedies for subpar performance, such as liquidated damages to compensate a customer for insufficient energy delivery, will not suffice if a resilience project fails during a disaster. On the other hand, achieving a state of reliability that absolutely assures no down time is prohibitively expensive.
The risk profile of a grid outage is asymmetric: the likelihood of occurrence is low, but the cost of an outage may be catastrophic. Resilience projects will require the development of new contractual and risk allocation approaches to minimize the chance of failure while remaining bankable. Performance measures will need to focus on maintaining an ongoing and measurable state of readiness rather than on performance during an outage. The risk of a catastrophic event can be shared between a private developer and the government if they agree on the required level of service and performance indicators for monitoring compliance.
Conclusion
Under a well-designed P3 arrangement, private capital can be raised to fund resilience infrastructure while assuring performance up to specified standards. Private developers can raise revenue by providing additional services from resilience assets, or by receiving contractual benefits from the facility benefitting from the infrastructure. Similar models could apply to resilience infrastructure in other sectors and could enable financing of infrastructure to improve resilience in the face of climate change.
* https://www.nap.edu/catalog/13457/disaster-resilience-a-national-imperative
State of the 2019 Electric Vehicle Market
By Paul Ruiz, Senior Analyst, Securing America’s Future Energy and the Electrification Coalition
Electric vehicle (EV) sales in the United States grew impressively in 2018. National data for the full 12 months ending in December show automakers sold more than 362,000 units, an 83 percent increase over 2017. This exceptional rate of growth was largely driven by one automaker, Tesla, which significantly ramped up its production capabilities in the third quarter and completed deliveries on its mass-market Model 3 sedan. More than half of all EV sales in 2018 were Teslas (52 percent) with the Model 3 capturing more than 38 percent of sales alone.
More than any other currently available battery electric vehicle (BEV), the Model 3’s success shows there is tremendous pent-up demand for more affordable all-electric cars. Consumers also demand choice, as evidenced by the growing number of models currently available in the national market and automaker announcements of new MY 2019 and 2020 rollouts.
This year and next, automakers will release at least a dozen new BEVs and plug-in hybrid electric vehicles (PHEVs) and a growing share of those additions will fulfill popular consumer interests, such as sports cars and sports-utility vehicles (SUVs). There are now more than 16 BEV models available and 29 PHEV models available to consumers nationwide. As battery costs continue to decline, analysts project a growing number of these cars will go further on a single charge and at a lower cost.
These are encouraging signs, but let’s temper our expectations for the EV market this year. EVs currently represent just one out of every 50 new vehicles sold in the United States: undoubtedly better than the nascent market of only a few years ago but still a niche within a car market that sold more than 17.4 million units last year.
According to the latest data from the Bureau of Economic Analysis and InsideEVs, the combined category for BEVs and PHEVs accounted for just above two percent of new vehicle sales in the United States. Much of that growth has been concentrated in states with robust zero emissions vehicle programs and driven by a federal $7,500 tax credit available to OEMs’ first 200,000 vehicle sales.
While automakers are introducing new models this year, some are being offered in limited quantities in a select few U.S. states. Mercedes, Porsche, and BMW have all announced new model year vehicles that fit this description. The high-end Mercedes EQC, for example, will be produced in large quantities in Europe but offered at significantly lower volumes in the United States. Mercedes—like many popular brands—is still developing plans to mass-market EVs in the U.S.
Complicating that strategy is U.S. consumers’ decisive shift away from smaller sedans and toward larger pick-up trucks and SUVs. On an annualized basis, light trucks represent an astonishing seven out of every 10 new vehicles sold in the United States, an unparalleled figure that does not show signs of slowing. “It’s Plug-ins Versus Pickups in the Newest Culture Crash,” read the headline in a recent Bloomberg Opinion piece. Accommodating this trend, several automakers have announced plans to introduce electric SUVs and crossovers in the next several years, joining the Tesla Model X, Jaguar i-Pace, and the Hyundai Kona EV that are on the market in 2019.
So, will the U.S. reach an inflection point in EV sales this year? The short answer is no (despite many positive market signals that suggest it could be in the medium-term future).
Last May, the International Energy Agency (IEA) said global EV sales will triple to 13 million by 2030, provided the world builds at least 10 gigafactories to produce batteries at scale. Given the improved efficiency and durability of U.S. light-duty vehicles and the slow turnover in the U.S. vehicle fleet, internal combustion engine vehicles (ICEVs) will be around for quite some time. To reach lift-off in EV sales figures—to the point of becoming a majority versus ICEVs—dedicated government policy alongside private sector R&D will be necessary to continue encouraging EV adoption, the IEA says. In the U.S., this could mean lifting the cap on the federal EV tax credit, advancing more state and municipal policies that increase EV awareness locally, encouraging consumers to test drive EVs, and continuing to build out the infrastructure to support this vibrant ecosystem.
Some of these policy levers are more politically practical than others. But if there is one key fact to which the auto industry is keenly attuned, it is the potential pace of change. Experience in personal computing, cell phones and smartphones all show us that past inflection points have a way of creeping up on us – just so long as the right ingredients are in the mix. As the EV market heats up in 2019, 1.1 million cumulative sales since 2011, 60,000 public and private EV charging stations, and automaker commitments to introduce a diverse line of EV models are just the recipe this slow cooker needs.
PJM’s Dysfunctional Capacity Markets
Robert L. Borlick, Senior Energy Advisor
PJM’s capacity market is inefficient and produces excessively high capacity prices and encourages chronic overcapacity. In effect, it is a welfare program for suppliers of capacity.
The fundamental problem is PJM’s Variable Resource Requirement (VRR) curve, which reflects how much PJM is willing to pay for an additional MW of capacity over a range of system reserve margins. Figure 1 illustrates the current VRR curve.
Figure 1 – The PJM Variable Resource Requirement (VRR) Curve
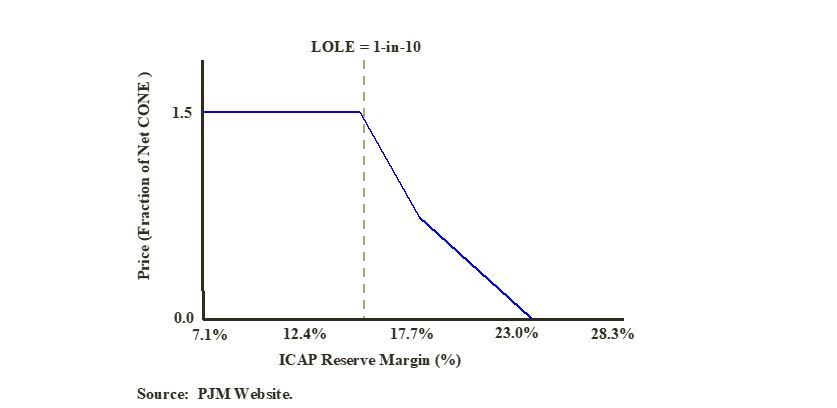
The fatal flaw is that the VRR curve does not reflect the economic value of capacity to wholesale electricity buyers. It is not a true demand curve, as defined by classic economic theory, but rather is an administrative construct based on a hypothetical notion of what the “cost of new entry” would be (Net CONE).
So how would one develop an economically sound VRR curve? A remarkable study funded by the FERC answered that question in 2013.* It estimated the economic value of various levels of reserve margin based on the costs avoided by a hypothetical ISO that is interconnected with three neighboring power systems and resembles PJM. Figure 2 illustrates the demand curves the study produced and compares them with PJM’s VRR curve.
Figure 2 – Economic Demand for Capacity Curve vs. the PJM VRR Curve
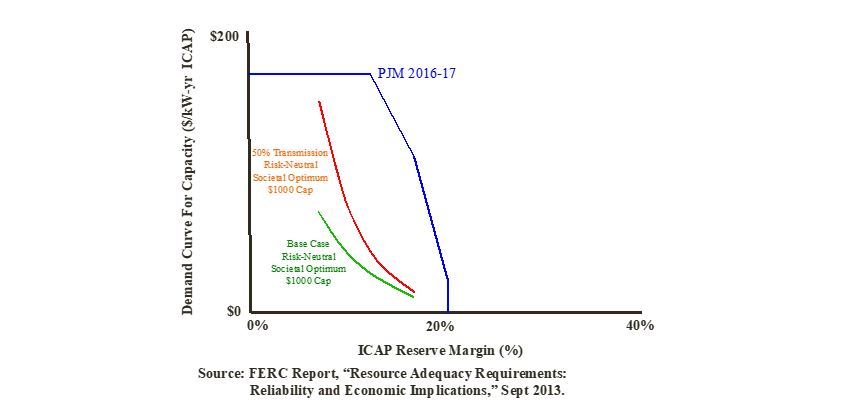
The study derived demand curves for different amounts of interconnection capacity. The 50% Transmission Case reflects a 50 percent reduction in interconnection capacity, relative to the Base Case, and reveals that the value of local installed capacity substantially increases when an ISO has less ability to rely on emergency imports from its neighbors.
It is notable that PJM’s VRR curve systematically produces substantially higher capacity prices for reserve margins in the neighborhood of those required to satisfy the industry’s LOLE standard of one event in ten years. This implies that PJM systematically pays too much for capacity, which encourages capacity surpluses and imposes excessive costs on electricity consumers within the PJM footprint.
Figure 2 also suggests that the LOLE standard is too conservative. It is noteworthy that Southern Company, one of the industry’s largest and most successful utilities, rejected LOLE more than 25 years ago and replaced it with an avoided cost-based standard like the one used in the FERC study. Yet PJM and most of the electric utility industry still slavishly rely on this 1960s standard - much like Linus in the “Peanuts” comic strip, clinging to his security blanket.
While I submit that the ideal market design is an energy-only market (e.g., ERCOT) I recognize the need for capacity markets to serve as transitional vehicles. Unfortunately, the current ISO energy and capacity market designs encourage excess capacity and also discourage the formation of price-responsive demand, thereby producing a vicious circle of market dysfunction. Both energy and capacity markets need to be redesigned to allow capacity markets to gradually fade away as increasing amounts of price responsive demand enter the markets.
* Federal Energy Regulatory Commission, “Resource Adequacy Requirements: Reliability and Economic Implications,” Sept 2013.
Naughty Children – Not Electric Utilities – May Drive U.S. Coal Demand This Winter
Carl Greenfield,Manager, Energy and Environment | International Technology and Trade Associates, Inc. (ITTA)
Remember when parents told us that Santa would leave a lump of coal in our stockings if we misbehaved? As Christmas 2018 quickly approached, it seemed that those naughty boys and girls could be the primary drivers for coal demand this winter. Analysts expect this trend to continue as U.S. utilities move away from coal-fired generation.
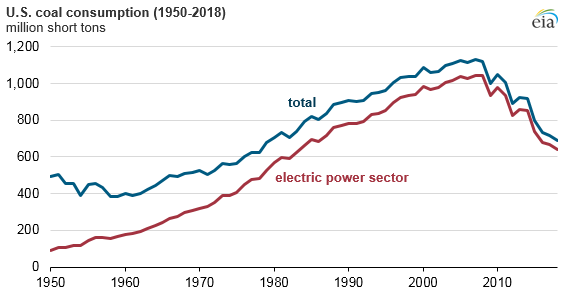
According to a recent EIA analysis, domestic coal consumption this year is expected to be the lowest in nearly 40 years, due to declining demand from the electric power sector. As capacity factors decrease and plant retirements increase, coal generators are facing increasingly stiff competition from low-cost natural gas and subsidized renewable sources.
Despite the Trump Administration’s recent efforts to roll back CO2 regulations, reform electricity market rules, and suggest declaring a “national emergency” to help the struggling coal sector, U.S. utilities continue to opt for cheaper, cleaner options.
Nothing highlights this trend more than PacifiCorp’s announcement in early December that shutting down nearly 60 percent of its current coal fleet by 2022 may be cheaper than keeping those plants in operation. In presentations to stakeholders involved in its 2019 long-term resource planning, the coal-heavy utility noted that 13 of its 22 coal plants are uneconomic and more expensive to operate than alternative options.
Although PacifiCorp’s announcement is far from an official shutdown notice, it is part of a larger trend regarding the economics of operating coal plants in today’s changing electricity sector.
Unless this trend reverses and coal generators can compete across the board in this new environment, naughty children may be the U.S. coal industry’s best bet to remain in business.